A simple low pass filter : average filter
The simplest low pass filter consist to take the current sample of a signal and add it with the previous sample. In fact, we compute the average of the 2 samples :
Y = [X + X(-T)]/2
where X : the current sample
X(-T) : the previous sample of the signal
T = time between 2 samples. Usually, there are 44100 samples per second (and then SR = sample rate = 44100 samples / seconde)
So, here is the ensemble exemple :
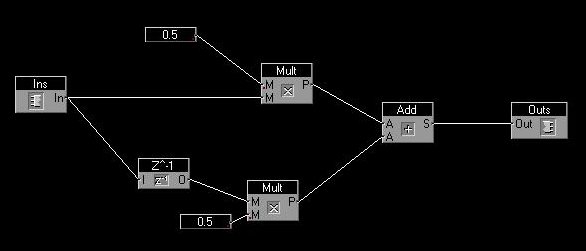
For reason explained later, in this ensemble, we took 4 previous sample. Run the ensemble and watch it with the sync modular oscillator when you vary the frequency of the sinus from 0 to 5300 hertz.
The "z-1" box just represent the previous sample of the input. At the beginning, the previous sample is not defined, so it is initialized at value 0).
In order to study filters, we use to take a sinus signal (with amplitude 1), then increase its frequency and watch how the output vary when it pass through the filter. If we have a low pass filter, the ouput must discrease at high frequency and stay the same at low frequancy.
So let's see how the output vary according frequency:
Frequency = 0
The little black square are the input samples of our sinus, and the little red square are the output samples.
So to calculate the red square at time 0, the output Y(0)) :
Y(0) = [X(0) + X(-T]]/2 = (1 + 1) / 2 = 1
Then, the output Y(-T) at the previous sample -T :
Y(-T) = [X(-T) + X(-2T]]/2 = (1 + 1) / 2 = 1
etc...
The output signal does not vary and is the same as the input
So at 0 frequency, the is no filtering and all the input goes to the ouput
Frequency = SR/4
Y(0) = [X(0) + X(-T]]/2 = (1 + 0) / 2 = 1/2
Y(-T) = [X(-T) + X(-2T]]/2 = (0 - 1) / 2 = -1/2
etc...
So the result are all the small red square...
We see that when the frequency = SR/4, the output signal is half of the input signal and also its phase is not the same (the pic or the "zero" of the ouput does not appear at the same time).
Frequency = SR/2
Y(0) = [X(0) + X(-T]]/2 = (1 -1) / 2 = 0
Y(-T) = [X(-T) + X(-2T]]/2 = (-1 + 1) / 2 = 0
etc...
We see that when the frequency = SR/2, the output signal is null. It has been totally filtered.
So, as expected, if we add the current sample and the last one of a signal, we obtain a low pass filter.
In this filter, the output signal is 0 at SR/2, so around 22000, which is barely visible with the oscilloscope of sync modular.
But if we take the 4de previous sample signal, the filter is 4 time faster and becomes null at around 5300 (22000/4) hertz, which is a more visible frequency in the sync modular oscillator.
A graphical interpretation
We imagine now the signal circulating along the circle at frequency F.
The graphic represent the signals at time t=0.
It shows how much X(-T) is delayed to X(0) according frequency.
X(0) is now laying at coordonnate (1,0)
At frequency=0, X(-T) = (1,0) and is located at the same point that X(0)
When frequency increase, the phase increase and X(-T) follow the bottom demi-circle.
At frequency = SR/4 it is located at (0,1)
and at frequency = SR/2 it is located at (-1,0)
To watch the result of our filter, we just have to add graphically the 2 vector X(0) and X(-T) moving along the demi circle and divise by 2. Then the result is the red little circle :
As we can see, when the frequency vary from 0 to SR/2, the amplitude of the filter goes from 1 (no filtering) to 0 (total filtering) and its phase goes to 0 (input and output is not shifted) to -90° (output delayed of a one quarter of period compared to the input)
This way to considere signal is very convenient because we can watch, on the same graphic, the amplitude and the phase when frequency vary.
Little more about graphical interpretation
z-1 can be considered as an operator that transform a sample to the previous one in the plan :
X(-T)= z-1*X(0)
So if we have :
Y(0) = [X(0) + X(-T)]/2
then :
Y(0) = [X(0) + z-1*X(0)]/2
or :
Y(0) = X(0)* (1 + z-1)/2
or :
Y(0)/X(0) = (1 + z-1)/2
H = Y(0)/X(0) is called the transfert function of the filter
H = (1 + z-1)/2
z-1 represent the shift between X(-T) and X(0) and vary from 0 to -1 along the unit circle.
H describe the small red circle and represent the shift between X and Y according frequency.